
Evacuation during Cyclone Phailin, Odisha (2013).
Source: The Hindu
On 12 October 2013, long before most of us regularly used the words climate risk or disaster resilience, a colossal storm gathered over the warm waters of the Bay of Bengal. Meteorologists watching the radar saw wind speeds climb past 200 km/h, comparable to a Category 4 hurricane, and tracked the cyclone’s march toward landfall in Odisha, India.
To anyone paying attention to the weather, it was a terrifying sight. Yet when the storm finally struck the coast near Gopalpur, something remarkable happened.
In the space of just a few days, the state’s disaster management system coordinated one of the largest evacuations in human history. Close to a million people were moved out of harm’s way, guided by early warnings, community preparedness, and evacuation protocols that had been deliberately strengthened after Odisha’s devastating 1999 Super Cyclone, a storm that recorded sustained wind speeds of around 260 km/h, made landfall with comparable ferocity, and claimed over 10,000 lives.
The contrast was stark. In 2013, despite comparable intensity, the death toll stayed in the double digits. And the story didn’t end there.
When Cyclone Yaas struck Odisha in May 2021, wind speeds were lower than the super cyclones of 1999 and 2013, but still severe enough to trigger large-scale flooding and infrastructure stress. Yet evacuations once again ran into the hundreds of thousands, cyclone shelters were activated early, and loss of life remained limited, reflecting how systems built over two decades continued to hold under pressure, as documented in official disaster-management records from Odisha and national authorities.
This wasn’t luck.
It was evidence of something deeper: disaster isn’t determined by the hazard alone. It emerges where danger intersects with human vulnerability and lack of readiness. Scientists who study climate and disaster risk have long pointed this out: similar natural hazards can lead to vastly different outcomes depending on social, economic, and institutional conditions. A powerful hazard, like a cyclone, only becomes a disaster when people and assets are exposed, vulnerable, and unprepared.
And that’s exactly what we want to unpack in this newsletter series: How do hazards interact with human systems to become disasters, and what do we actually do about it?
Dear Readers,
When we look back at disasters that changed lives; cyclones, floods, heatwaves, it’s tempting to focus on the moment of impact. The landfall. The rainfall totals. The wind speeds.
But the real story often unfolds much earlier. Long before a storm forms over warm water or a river spills its banks, societies are quietly shaping how that event will be experienced. Through planning or neglect, investment or delay, systems that either bend under pressure, or snap.
This is where resilience enters the conversation.
In climate science, resilience isn’t about strength in the heroic sense. It’s not about standing firm against nature. Instead, it’s about how systems respond when stress arrives.
In simpler terms: resilience is what determines whether disruption becomes devastation, or remains a temporary shock.
This is why two communities in similar geography can face the same cyclone, the same flood intensity, the same heatwave, and experience completely different outcomes. One struggles for years. The other recovers, adapts, and moves forward. Resilience doesn’t eliminate risk. It reshapes consequences.
How We Measure Climate Risk
By the time we begin talking about resilience, one truth becomes unavoidable: we can’t reduce what we don’t know how to measure.
Climate risk is often described in broad terms; high risk, vulnerable region, exposed communities. But for governments, companies, and planners, these labels are not enough. Decisions require clarity: a way to compare places and assets, understand why risk differs, and identify where intervention will have the greatest impact.
Figure 1 lays out the framework we use to do this, built on the widely accepted IPCC risk framework. It grounds climate risk in three interlinked components, the physical hazard itself, what lies in its path, and how susceptible those systems are to harm. By separating these elements, it moves the conversation away from vague assessments toward diagnosis.
Let’s unpack each of these components the way the framework intends.
Figure 1- Climate Risk Framework
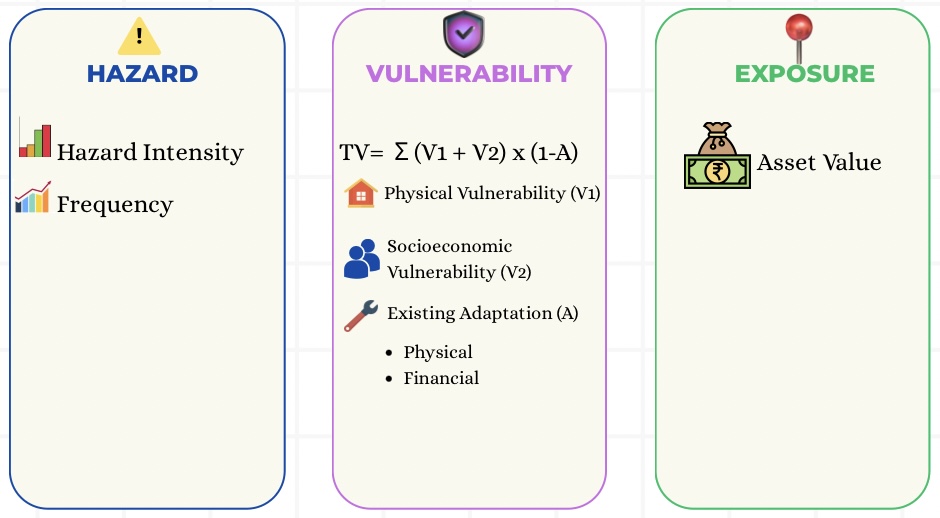
Hazard: How Intense, How Often, and How It’s Changing
In this framework, a hazard is not just identified by whether it occurs, but by how intense it is, how often it occurs, and how those patterns are changing over time. Heatwaves, for instance, are measured by the number of consecutive days and nights exceeding temperature thresholds, capturing not just daytime heat but the lack of nighttime cooling that drives health impacts.
Cyclones are classified by category and sustained wind speed, with storms crossing defined intensity bands that signal potential damage. Flood hazards are quantified through rainfall intensity, river discharge levels, and the spatial extent of inundation, often mapped using satellite imagery to show how much area is affected. These measurements are grounded in long-term observations, reanalysis datasets, and climate models that project how hazards may intensify under future warming scenarios. A robust hazard assessment therefore captures both historical behavior and future trajectory, translating physical climate signals into metrics that can be applied at the district, city, or even asset level, where real decisions are made.
Exposure: What Is in Harm’s Way
If hazard tells us what can happen, exposure tells us what stands to be affected. Exposure is defined very differently depending on who is asking the question, as shown in Figure 2.
Figure 2- Dimensions of Exposure
![]()
The same location can therefore have multiple exposures; social, economic, and physical, layered on top of one another.
Exposure is measurable. But too often, it is treated as static, when in reality, it changes rapidly with development patterns, land-use decisions, and economic growth.
Vulnerability: Where Risk Is Amplified
Vulnerability is where climate risk becomes most consequential. It captures how susceptible exposed systems are to harm, shaped not only by physical conditions, but also by social and economic realities, governance, and preparedness.
In practice, vulnerability is often discussed in broad terms, but rarely in ways that support clear action. This is a critical gap. Resilience cannot be strengthened if vulnerability remains theoretical. What matters is whether vulnerability can be observed, compared, and reduced through deliberate choices.
Existing adaptation plays an important role here, reflecting the measures already in place that reduce the impact of hazards, whether through stronger structures, early warnings, or financial buffers that help absorb losses and speed recovery.
Because vulnerability is where outcomes diverge most sharply, it warrants deeper attention.
The next section focuses on this in detail.
Deconstructing Vulnerability: Physical, Socio-Economic, and Adaptive Dimensions
1. Physical Vulnerability: When Structures Fail First
Physical vulnerability refers to how susceptible built assets and physical systems are to damage when a hazard occurs.
Figure 3- High vs low physical vulnerability
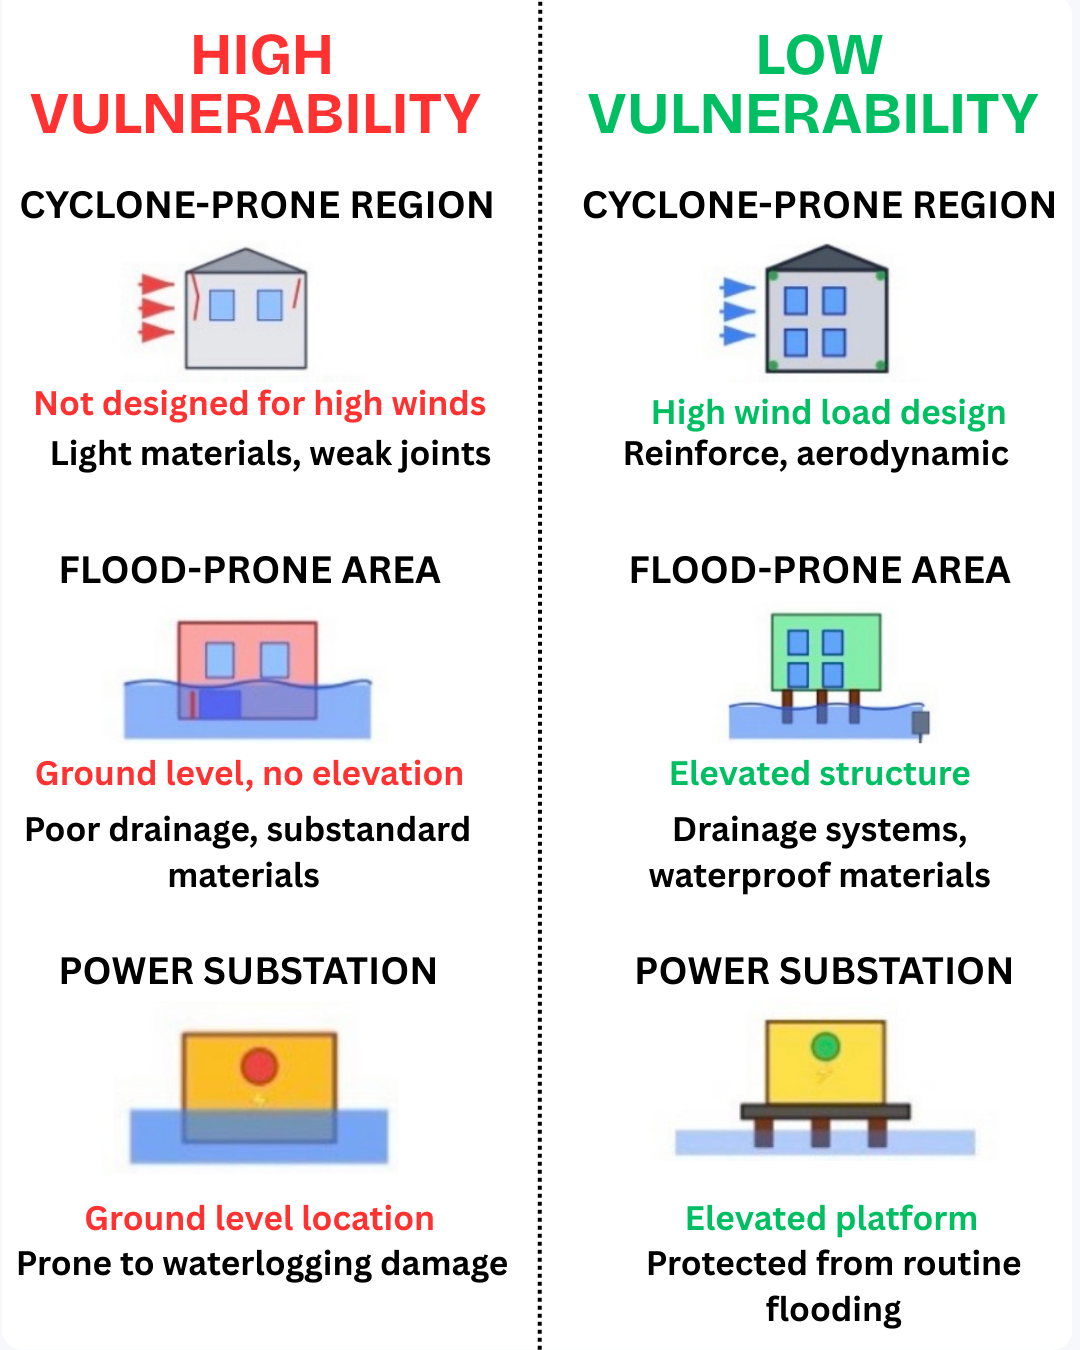
Think of buildings not designed for high wind loads in cyclone-prone regions. Roads without adequate drainage in flood-prone districts. Power substations located at ground level in areas where waterlogging is routine.
A clear example comes from floods in urban India. Studies following major flood events in cities like Chennai and Mumbai have shown that poor drainage design, encroachment on natural waterways, and substandard construction materials significantly increased damage, even where rainfall levels were comparable across neighborhoods.
Physical vulnerability is measurable through indicators such as: building typology, age of infrastructure, elevation, material strength, and compliance with hazard-resistant design codes.
Where physical vulnerability is low, because structures are elevated, reinforced, or designed for extremes, damage is often contained. Where it is high, losses escalate rapidly.
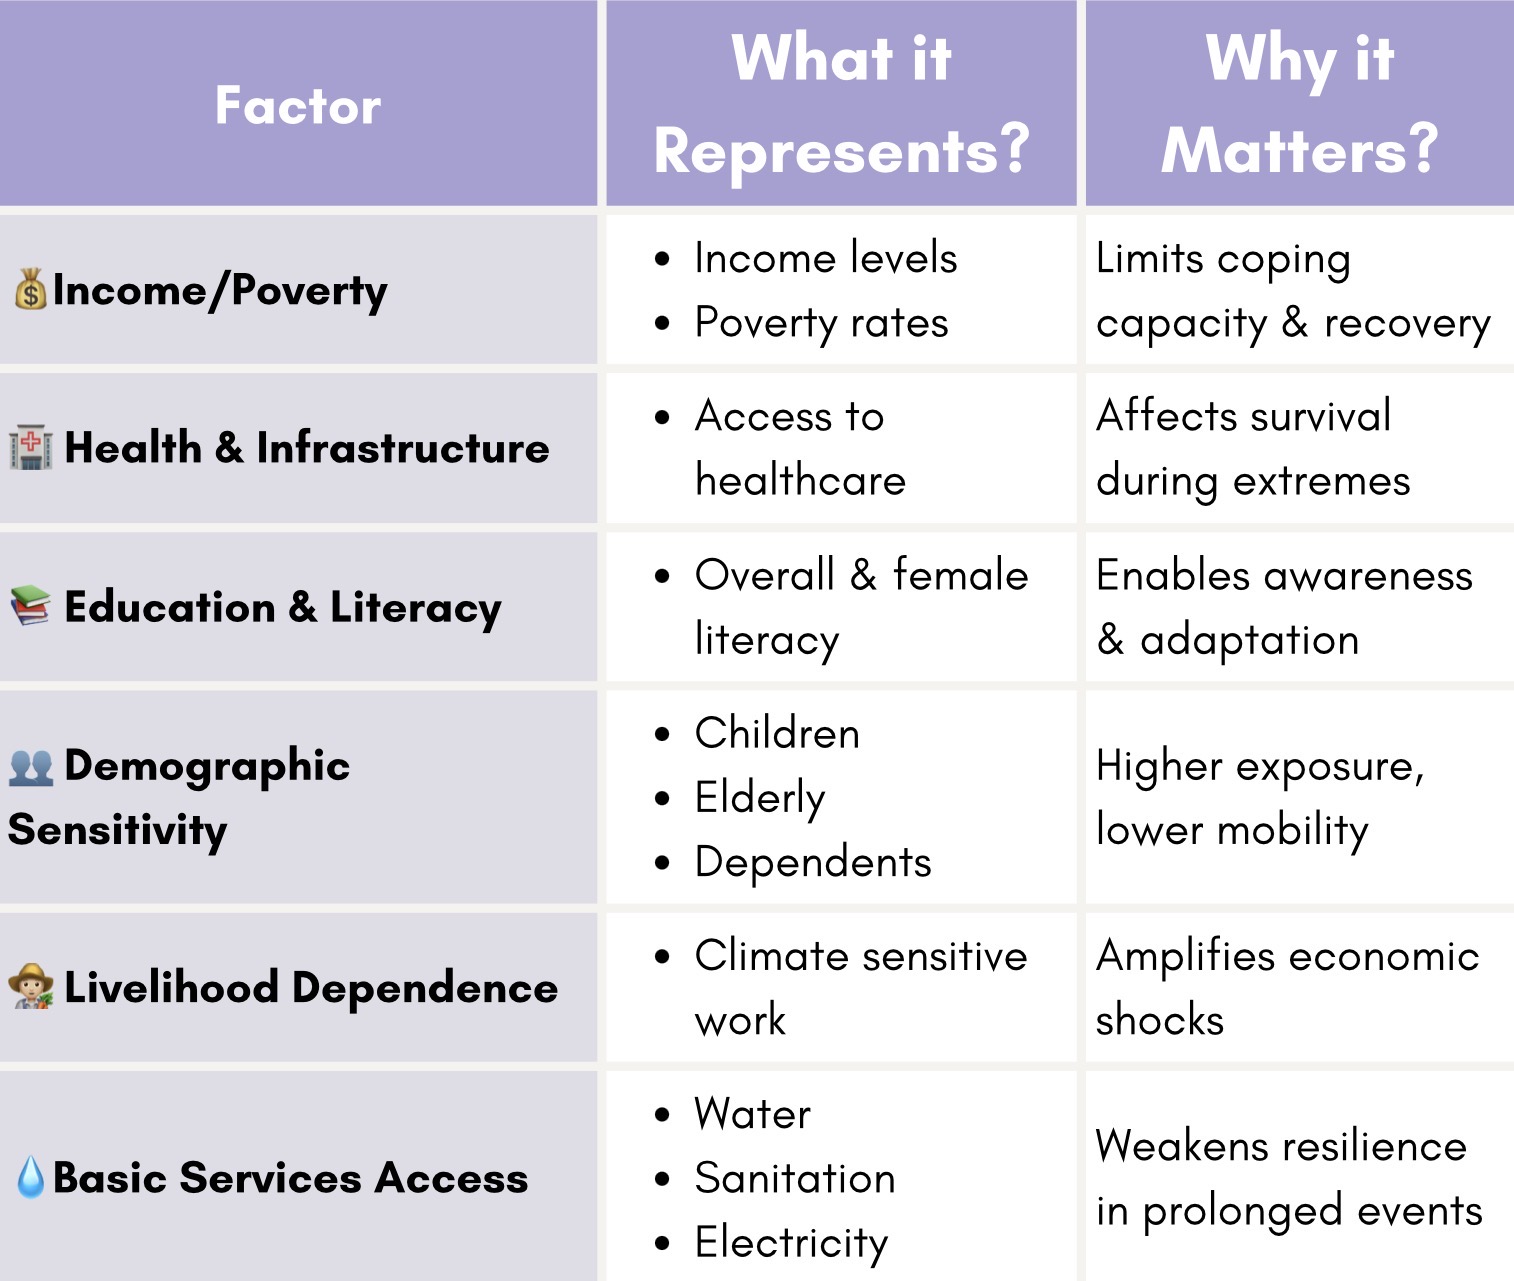
2. Socio-Economic Vulnerability: Why Impact Is Unequal
Socio-economic vulnerability explains who is hurt most and why recovery is uneven, even when hazards are the same. Differences in income, health access, education, gender equity, and social protection shape how communities experience and recover from climate shocks. The IPCC consistently finds that communities with lower income, weaker institutions, and limited access to services face disproportionately higher losses, even when hazards are identical.
A heatwave is a useful example. In Indian cities, extreme heat affects everyone, but informal workers, elderly populations, and those without access to cooling or healthcare bear the brunt. Research following the Ahmedabad Heat Action Plan showed that improved early warnings and targeted interventions significantly reduced heat-related mortality, especially among vulnerable populations.
Socio-economic vulnerability reminds us that climate risk is never just environmental, it is deeply social.
Table 1- Key Indicators of Socio- Economic Vulnerability
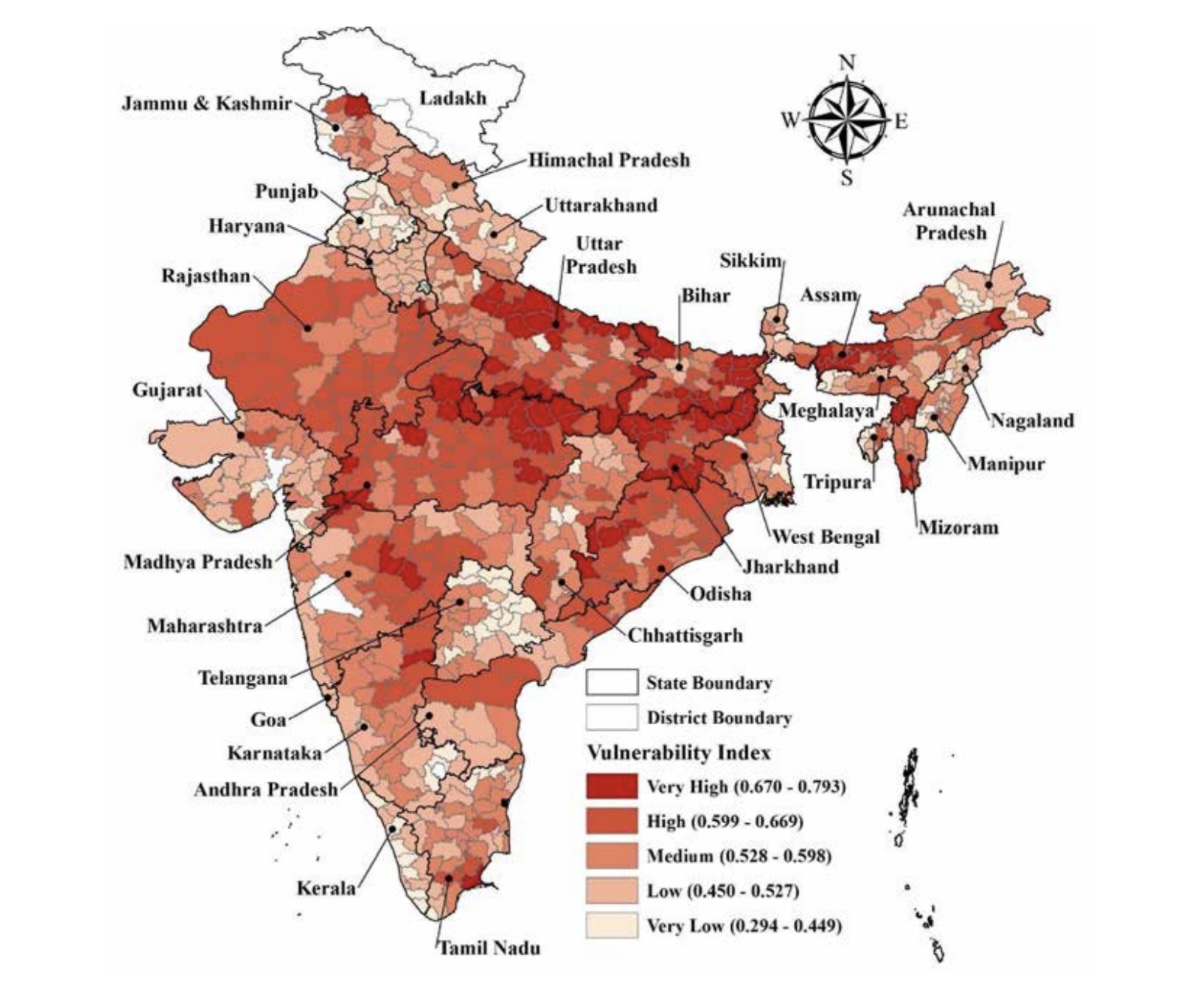
The district-level vulnerability map given below, published by the Department of Science and Technology (DST), Government of India (2024), reveals a highly uneven and spatially clustered pattern of vulnerability across the country. High and very high vulnerability is concentrated across parts of eastern, central, and northeastern India, driven less by where hazards are strongest and more by underlying differences in income, health access, infrastructure quality, climate-sensitive livelihoods, and adaptive capacity. What the map makes clear is how compound risk emerges, when social and economic fragilities amplify physical hazards, turning similar climate events into vastly different human outcomes and highlighting the decisive role of development pathways in shaping resilience.
Figure 4- District-level Vulnerability Map of India
3. Existing Adaptation: The Buffer That Already Exists
Existing adaptation refers to measures already in place that reduce the impact of hazards before losses escalate, acting as buffers that limit how disruptive climate extremes become.
Physical adaptation includes strengthened infrastructure and preparedness, for example, elevated buildings in flood zones, cyclone shelters, and improved drainage.
Financial adaptation works differently: it helps households, workers, and small enterprises absorb shocks quickly without falling into long-term distress.
An example is parametric insurance, a data-driven product that pays out automatically when a predefined trigger is reached, without the usual damage assessment. For heatwave-prone regions, this could mean an automatic payout when daily temperatures exceed a threshold (e.g., 42 °C), providing immediate cash support to vulnerable groups such as construction labourers or informal workers.
Another example is climate-smart credit, loans structured around local climatic cycles rather than fixed seasons. For flood-prone communities, repayments can be reduced or rescheduled during monsoon months when incomes are low, and small “resilience top-ups” can be added pre-event to support preparedness. These products have been piloted in agricultural and climate finance programs to align credit with climate risk and cash flows.
Table 2- Examples of Climate-Smart Credit Products
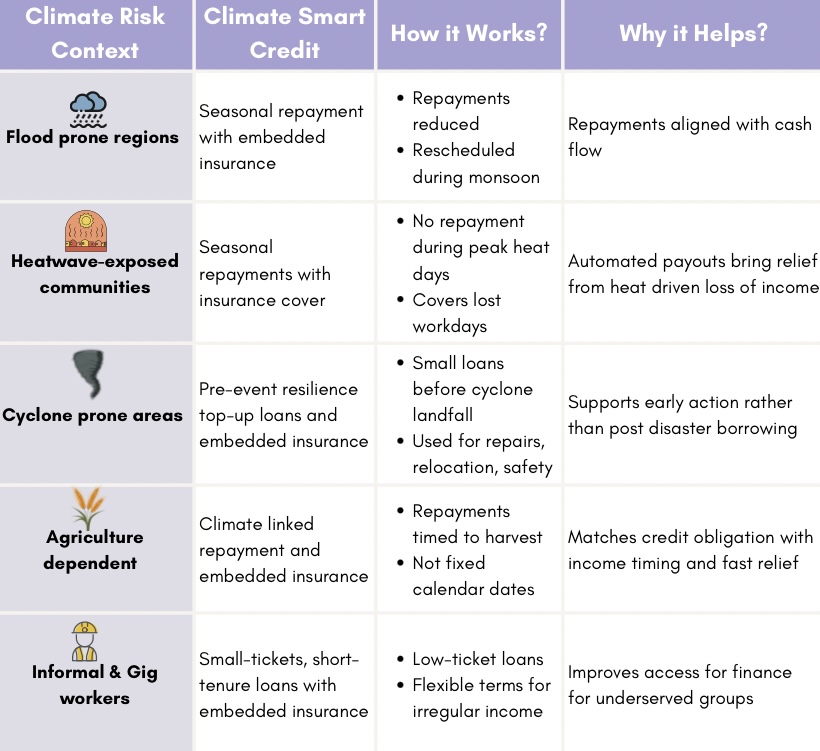
Where such adaptation mechanisms exist, vulnerability is lower; where they are absent, even moderate hazards can cascade into long-term economic loss.
Hazard-Specific Resilience in Action
Frameworks help us understand risk. But resilience is built, or lost before a hazard makes landfall.
Across India, some of the most effective climate-risk interventions have not been massive infrastructure projects, but early warnings, preparedness protocols, technology use, and community-level readiness that shorten response time and reduce exposure before impact.
The table below synthesizes how this plays out across different hazard types, drawing on real examples, particularly from cyclone-prone coastal states like Odisha and Tamil Nadu.
Table 3- Hazard- Specific Resilience Measures Across Climate Extremes
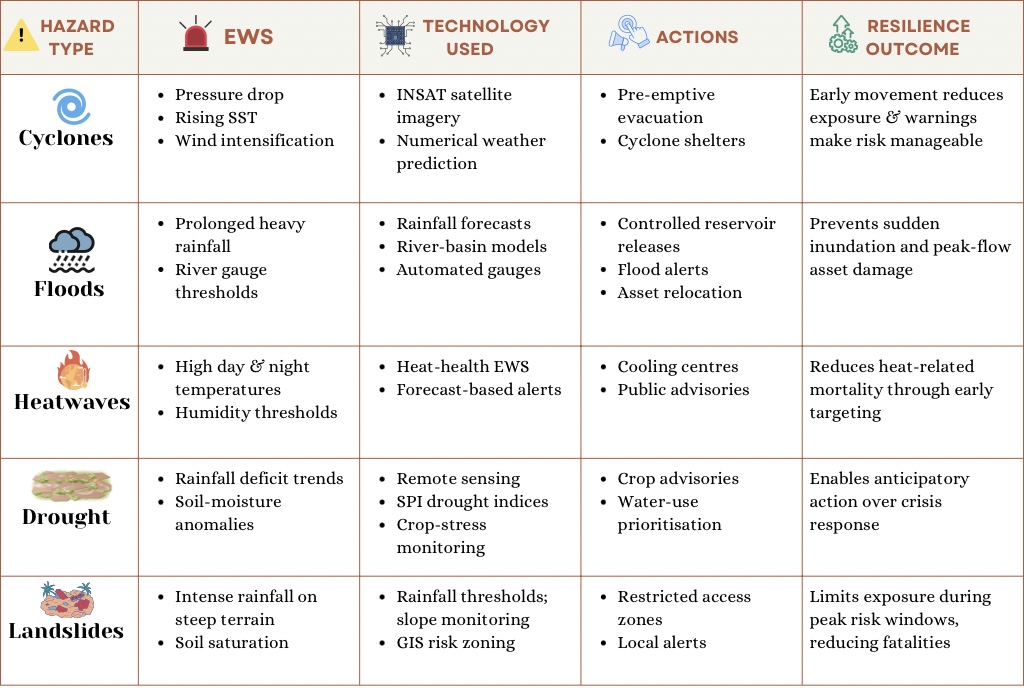
Table 4- Tools Enabling Climate-Informed Planning & Decision- Making
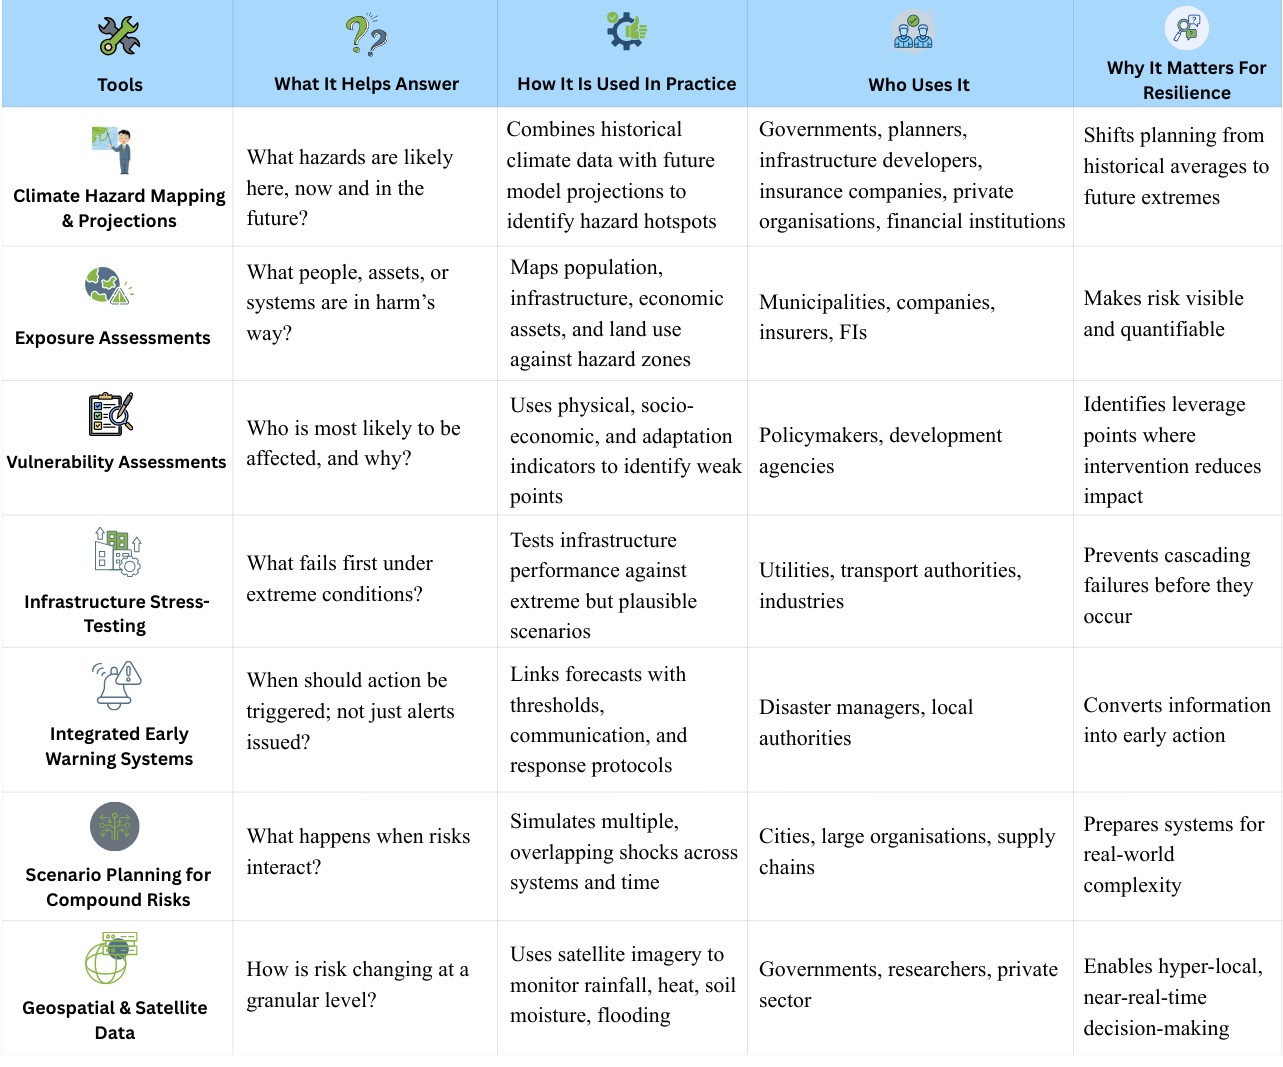
Taken together, the tools in table 4 point to a clear shift in how climate resilience must be built. Effective action now depends on bringing three domains together: climate science that explains what is changing, deep tech; including advanced geospatial intelligence, satellite data, machine learning, and AI, that translates those signals into usable insights, and a clear understanding of economic and social impact pathways that determine who is affected and how recovery unfolds.
This trinity is difficult to achieve through conventional, siloed approaches because it cuts across disciplines, institutions, and sectors. Yet when these domains are synthesised through a data-driven, tech-enabled, and feedback-led process, resilience building can be decentralised, faster, and more adaptive. Continuous feedback, from local outcomes back into models and tools, is what allows systems to improve over time. This kind of collaboration is complex, but it is also where collective impact becomes possible.
Figure 5- Integrating Science, Technology, and Impact Pathways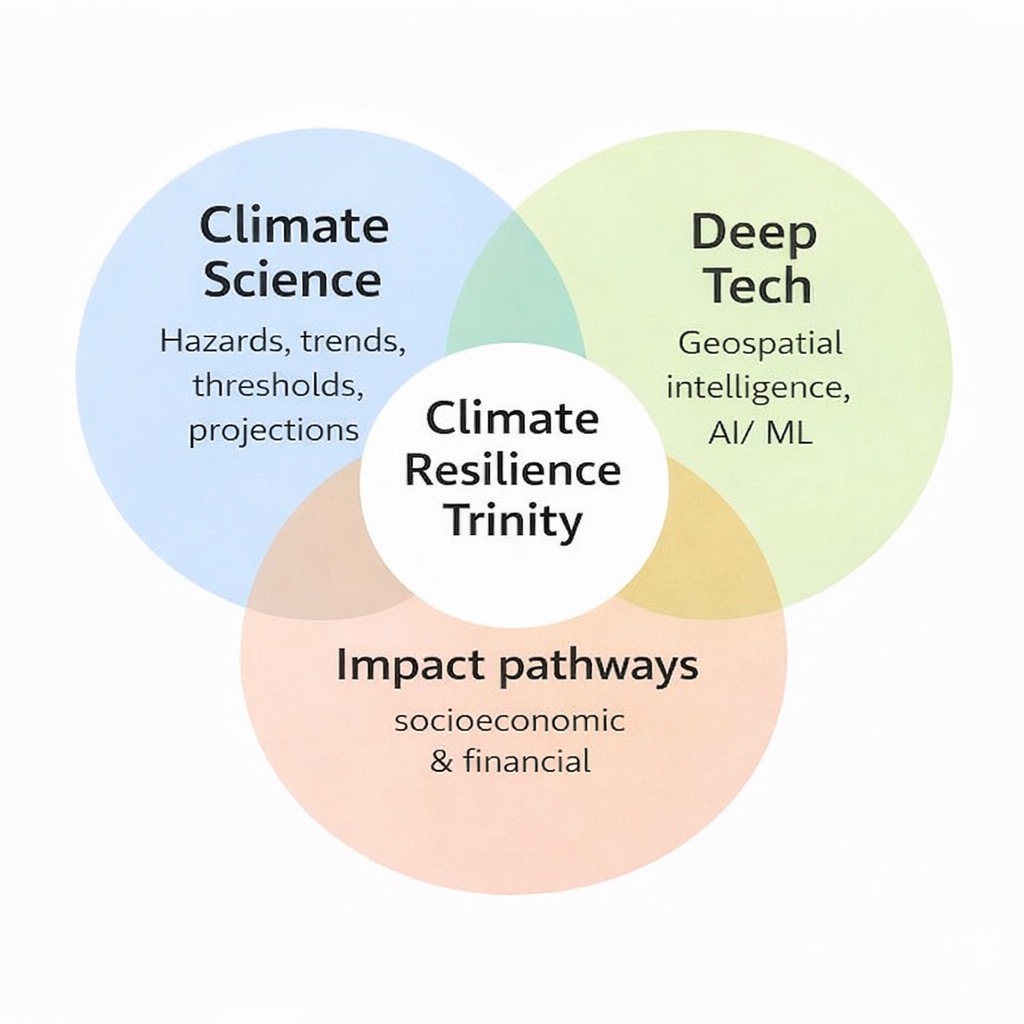
Where Do We Go From Here?
Climate risk does not suddenly appear at the moment of impact. It is shaped quietly over time, by where we build, how we grow, and who is protected when systems come under stress. While relief and reconstruction remain essential, the science is clear: reacting after losses occur addresses symptoms, not causes. As hazards intensify, resilience depends on shifting toward anticipatory planning, acting before damage becomes inevitable.
This means integrating vulnerability into everyday decisions, from urban planning and infrastructure design to financial systems, so exposure is limited and shocks do not cascade into long-term failure. It also means recognising that risk is felt most sharply at the local level, even as better geospatial data and analytics now make hyper-local planning increasingly possible.
What emerges is not inevitability, but agency. We cannot control every hazard, but we can control how exposed and vulnerable our systems are, and how prepared we are to act. When adaptation is treated as an investment rather than a cost, outcomes change.
In the next part of this series, we will turn to financial adaptation tools, particularly how instruments like insurance, risk transfer, and climate-smart finance can help absorb shocks and speed recovery, reducing the long-term impacts of climate events.
There is a way forward.
And we are already walking it.
“It is not the strongest of the species that survives, nor the most intelligent, but the one most responsive to change.”
~Charles Darwin