Beyond Floodplains: Understanding Emerging Flood Risk in a Changing Climate
From shifting monsoons to supply-chain disruption, why yesterday’s flood maps are no longer enough.
Figure 1: When Safe Zones Flood
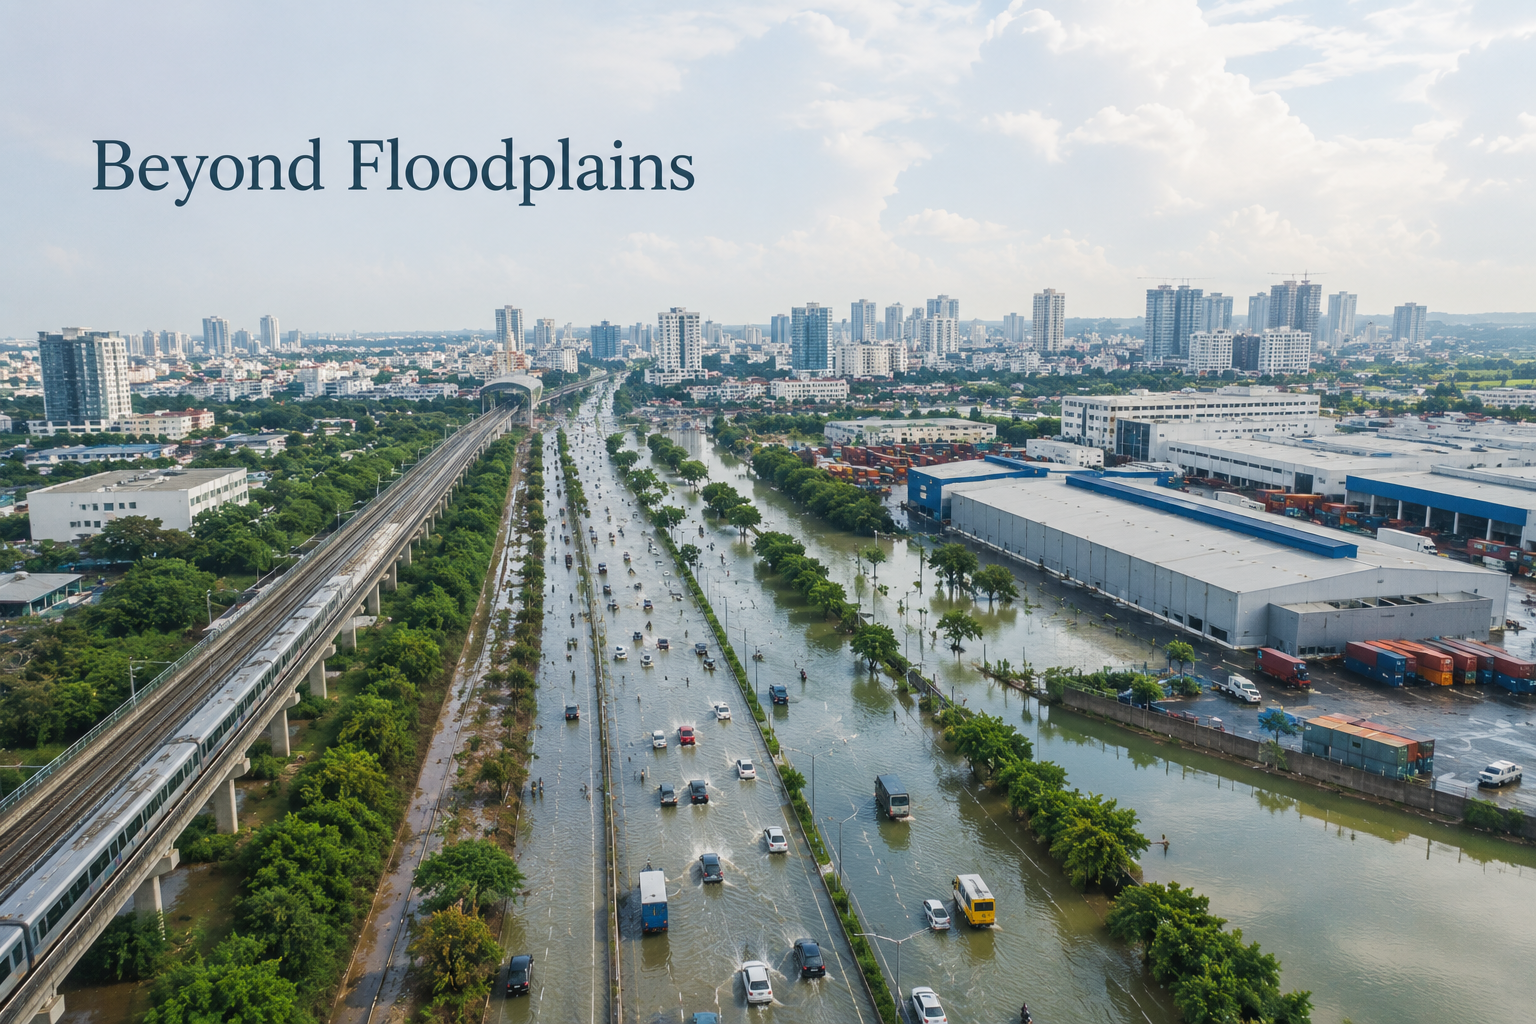
In the last article we examined how heat stress disrupts supply chains but the story includes more than just heat as its main element. Climate change now brings floods to areas that were never built to deal with these disasters.
That is the new climate reality. Floods are now hitting places that were once assumed to be safe. India Water Portal notes that flash floods are moving into once-considered “safe zones,” and that dry soils, concrete surfaces, and intense bursts of rain can turn even arid landscapes into fast runoff channels.
India has already witnessed this transformation. In 2010, a cloudburst devastated Leh, a cold desert region that receives less than 100 mm of annual rainfall. Since then, similar surprises have appeared across very different landscapes: Chennai’s devastating floods in 2015, Hyderabad’s urban flooding in 2020, In July 2023, Delhi recorded its highest Yamuna water levels in decades, disrupting transportation, government services, and economic activity across the National Capital Region.
Beyond India, Dubai’s 2024 floods showed that even one of the world’s driest urban environments is not immune to extreme rainfall. These events point to a common reality: places once considered low-risk are increasingly experiencing climate shocks they were never designed to absorb.
Similarly, In Sumatra, late-2025 floods and landslides showed the same pattern in the Global South: once water takes out a transport corridor, the shock moves instantly through supply chains, inventories, and production schedules.
These disruptions are no longer isolated incidents. What begins as a local flood increasingly becomes a regional economic shock as damaged roads, ports, warehouses, and industrial corridors interrupt the movement of goods. Reflecting this growing concern, Everstream Analytics’ Annual Risk Report identifies flooding as one of the most significant risks facing global supply chains, highlighting how climate-related disruptions are becoming a major operational challenge for businesses worldwide.
What makes this shift so unsettling is that it is not only about more rain, but about where rain falls and how land responds. In arid regions, dry soil can produce rapid runoff instead of absorption, and when that is combined with urbanization over floodplains, water has fewer places to go and far less time to slow down.
If flood risk is expanding into places once considered safe, the obvious question is why. The answer lies in a combination of climatic and environmental changes that are altering how, where, and when extreme rainfall occurs.
The Science: What’s Driving the Shift
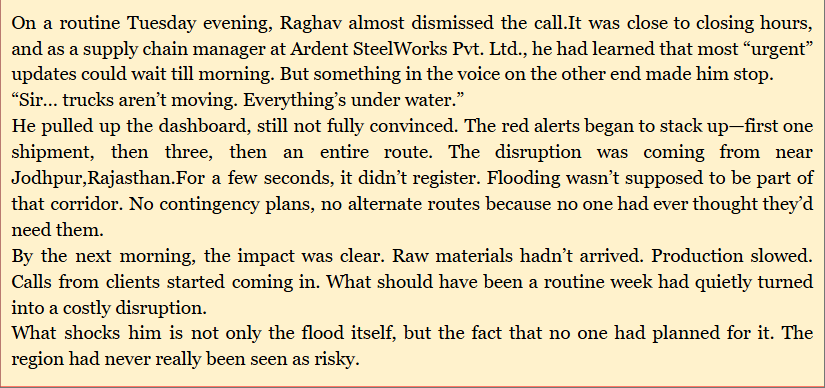
Flooding across India is no accident of fate. A growing consensus among scientists is that climate change is reorganizing India’s flood risks. Rising ocean temperatures, monsoon instability, land-use change, and interacting weather hazards are all aligning to redraw India’s flood risk map. In effect, the historical assumptions about “safe” arid or upland zones no longer hold. The rest of this section unpacks the key drivers behind this change.
Figure 2: What is Redrawing India’s Flood risk map?
Intensifying monsoon and extreme rainfall
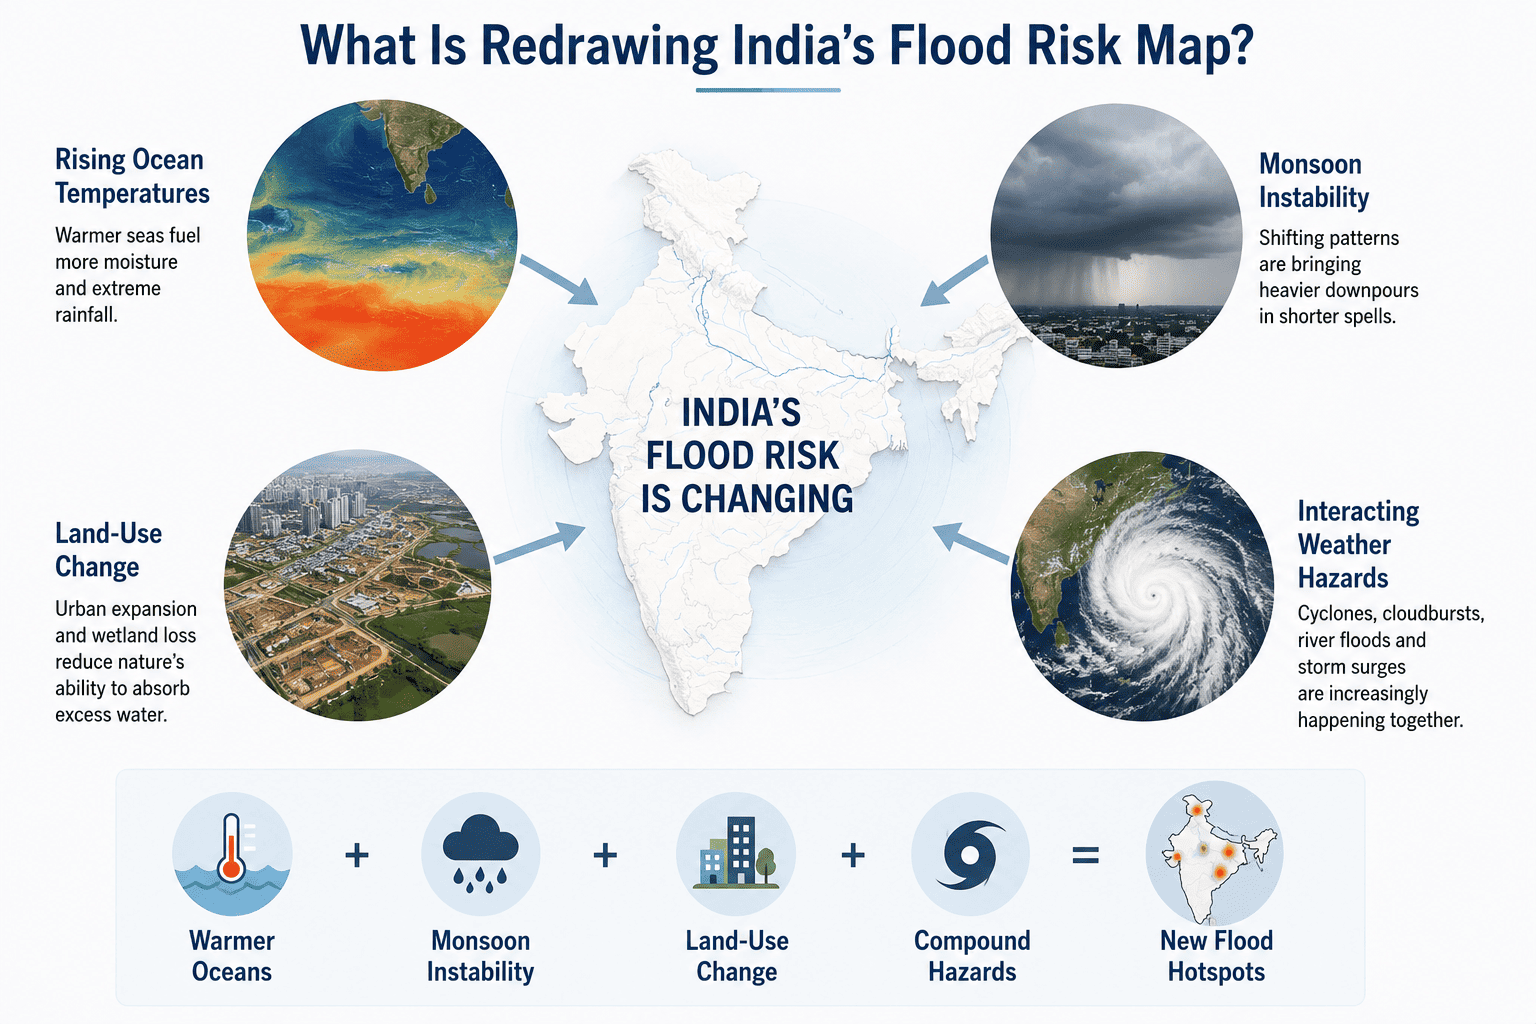
Climate change has made the monsoon more variable, causing much of the annual rainfall to arrive within a space of weeks. Research from NASA indicates that the percentage of individuals worldwide residing in flood-prone regions has increased by 20% to 24% since 2000 tenfold higher than earlier projections, as climate change leads to extreme rainfall, elevated sea levels, and stronger hurricanes
Extreme precipitation events have also intensified, with coastal Gujarat experiencing about 0.15 additional extreme events every decade during 1951–2024. In September 2017 Mumbai experienced flooding due to extreme precipitation (330 mm in 24 h), which largely affected road transportation. Similarly, on August 24, 2025, the IMD, in its press release, reported very heavy to heavy rainfall in Jammu and Uttarakhand respectively. In practical terms, much of the annual monsoon rainfall is now dumping in a few weeks rather than being spread out.
Figure 3: The Intensification of India’s Monsoon
 Source: Sciencedirect
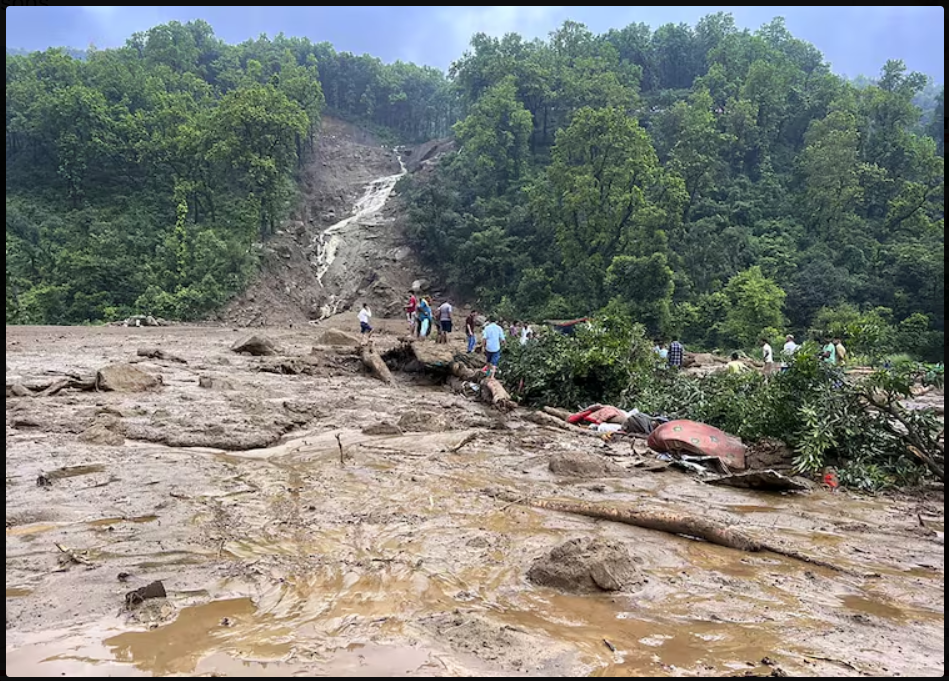
In each case, a week-long buildup of rain saturated soils, then an extreme burst overwhelmed rivers and reservoirs. The result was catastrophic flooding far beyond any reasonable design standard. In short, a warming atmosphere holds more moisture, and when monsoon winds funnel that moisture over the subcontinent, it falls in exceptionally heavy spells.
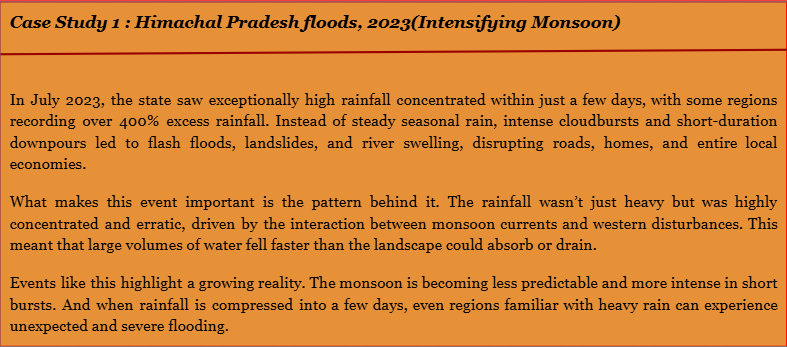 Source: Understanding the 2023 monsoon catastrophe in Himalayan mountains ; western disturbances
Figure 4: Devastation due to Torrential monsoon rains in Himachal Pradesh
 Source– Himachal floods,India Today
Compound events: Cyclones, surge and landslides
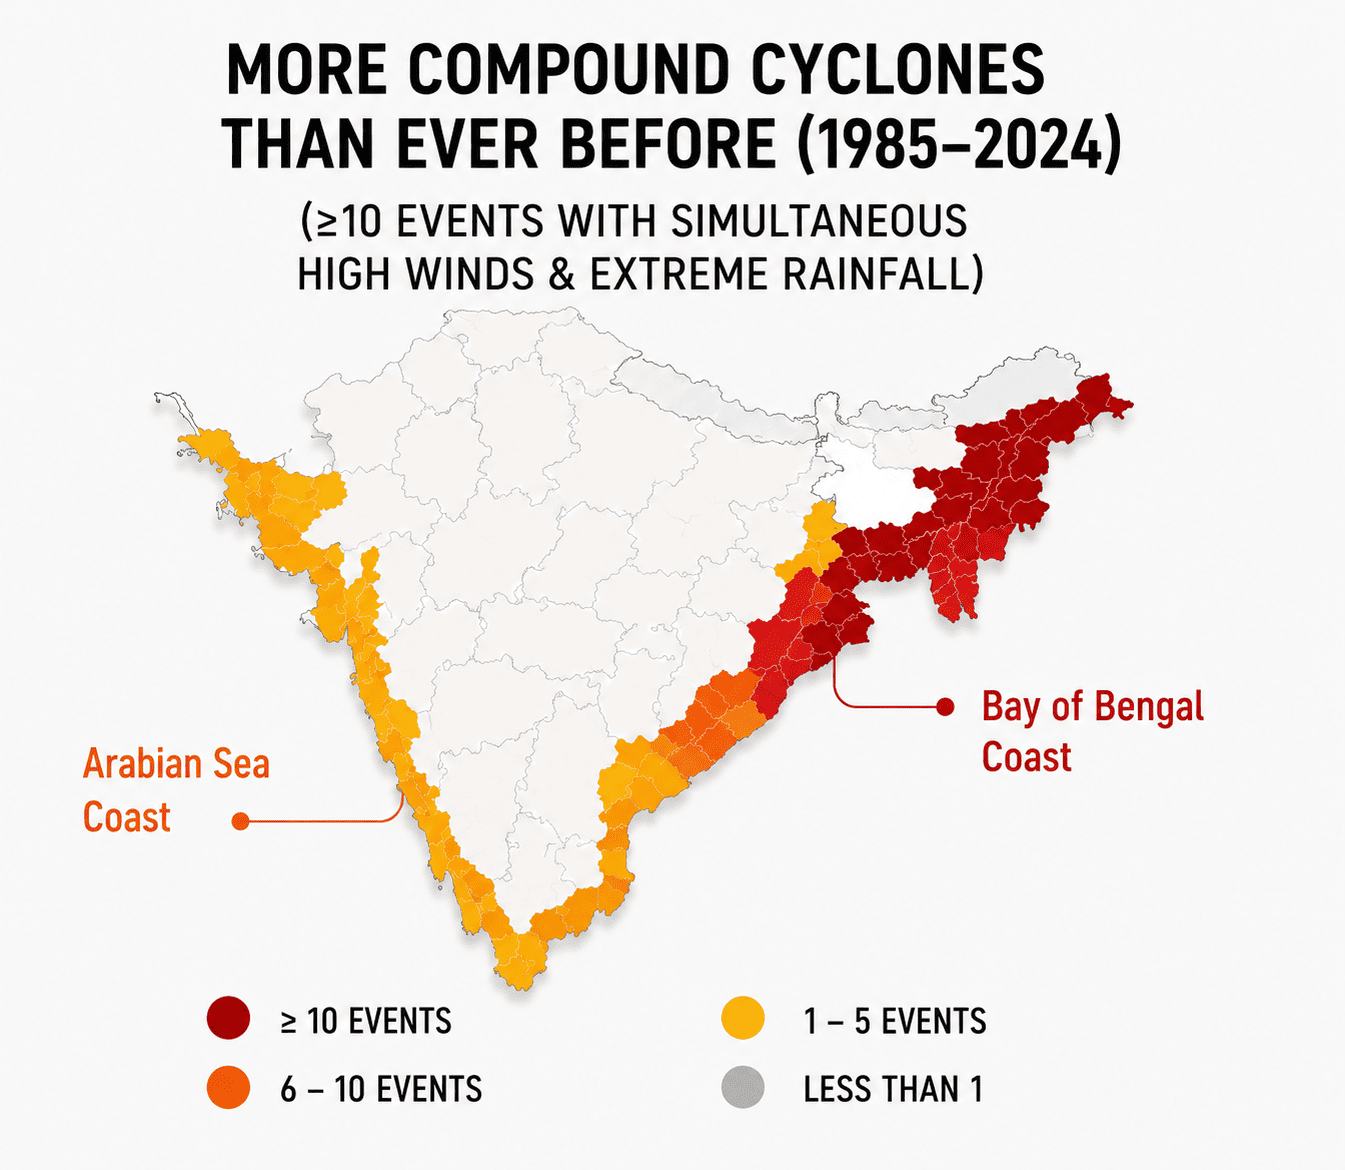
Another trend is the rise of compound hazards, multiple extremes hitting simultaneously. A particularly dangerous combination is tropical cyclones bringing high winds and torrential rain at the same time. As the tropical Indian Ocean has warmed (~0.12°C per decade since 1950), both cyclones and sea levels are intensifying, amplifying coastal flood risks. A recent mapping of cyclone impacts shows that India’s eastern and western coasts now see the highest frequencies of simultaneous wind and extreme rainfall events. In fact, eastern coastal states and adjacent inland areas have experienced the most compound cyclones (≥10 in 40 years) with concurrent extreme gusts and rain.
Coastal compound flooding can also arise when storm surge coincides with peak monsoon rivers. For instance, one study finds that the Bay of Bengal coast commonly experiences concurrent storm surge and heavy rain during the June–November monsoon (driven by Bay low-pressure systems), whereas the Arabian Sea coast sees overlapping surge-rain episodes during the southwest monsoon. These compound sea-level events inundate cities from both above and below, vastly worsening flood damage. Simultaneously, heavy monsoon rains on saturated hill slopes increasingly trigger landslides and flash floods. In short, storms today deliver a one-two punch (storm surge + rain + runoff) far more often than in the past.
Figure 5: Compound Cyclones
 Source: Compound Cyclones mapping
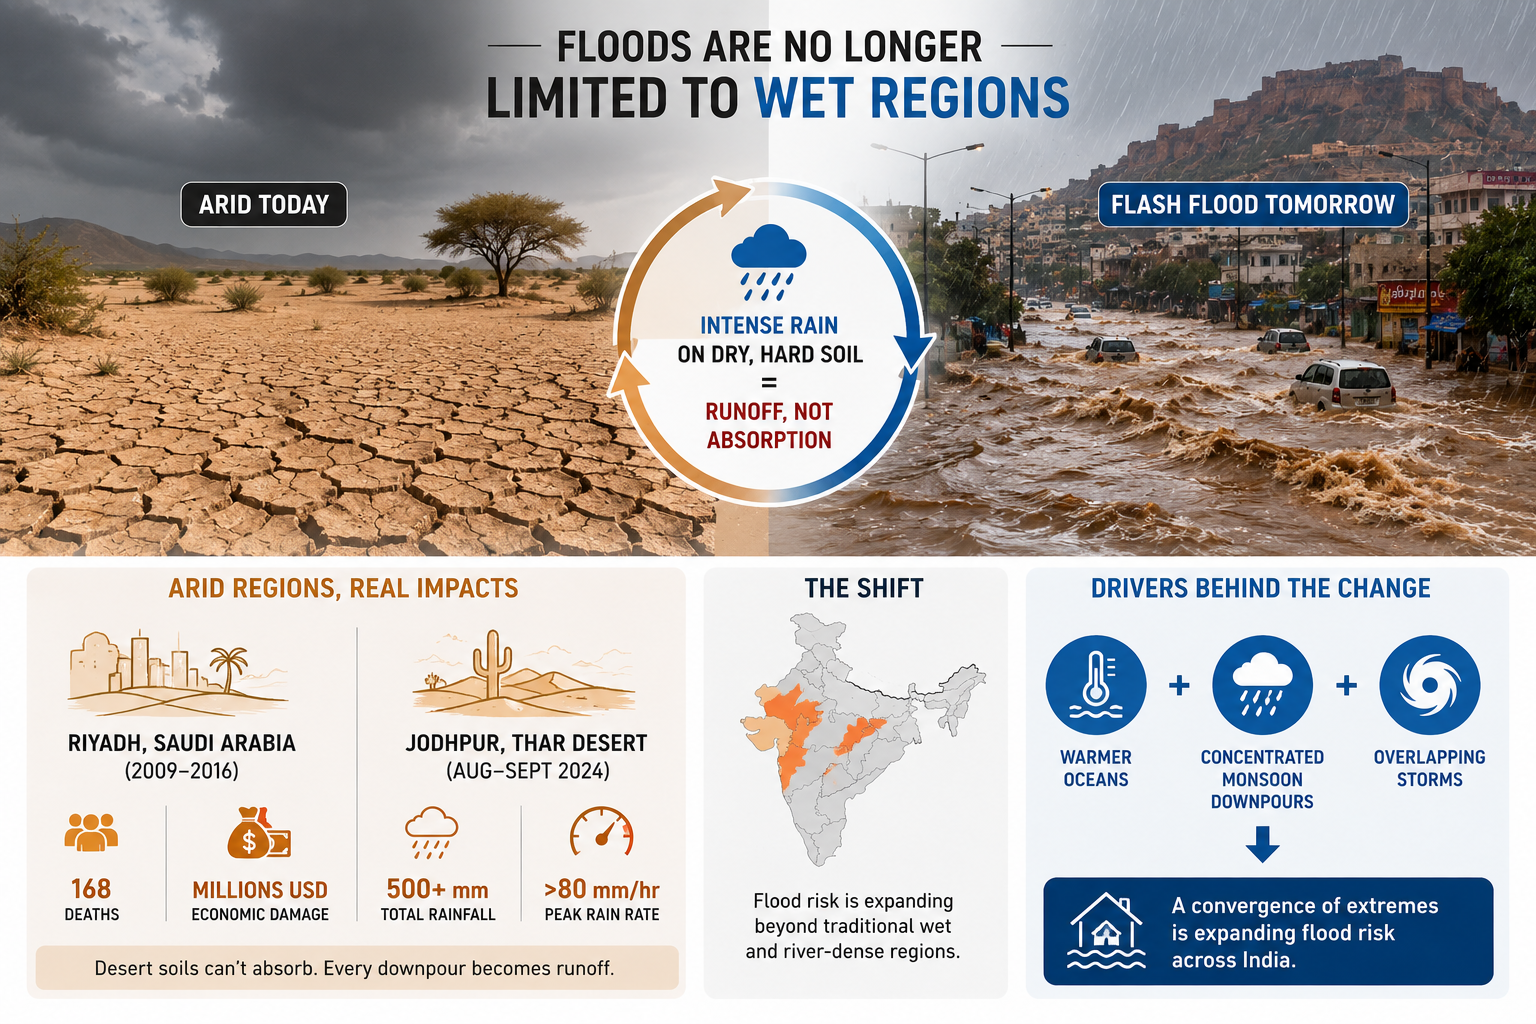
Flooding in Arid Regions
One of the most striking changes is that flooding is no longer limited to wet or river-dense regions. Even arid parts of India are seeing flash floods when intense rain falls on dry, hard soil that cannot absorb water quickly. Even in recent decades, the floods that occurred in arid and semi-arid regions have been responsible for a high number of fatalities and considerable economic damage in these regions. For example, catastrophic floods hit Riyadh in Saudi Arabia during 2009–2016, resulting in 168 deaths and millions of USD of economic damage to homes, businesses, and transportation infrastructures.
Similarly, one report notes 11 extreme storms in Aug–Sept 2024 over Jodhpur (Thar Desert), dumping 500+ mm total with peak rates >80 mm/hr. Such rates exceed desert soils’ absorption, so virtually every downpour becomes runoff.A convergence of warmer oceans, concentrated monsoon downpours, and overlapping storms is expanding flood risk in India.
Figure 6: Flooding in arid Regions
What this means for the future
If current warming continues, the evidence suggests that India’s flood risk will become more frequent, more intense, and harder to predict. Climate model projections show that India’s monsoon rainfall could increase by ~6-8% by mid-century, but more importantly, extreme rainfall events are expected to become stronger and more unevenly distributed,meaning more rain falling in shorter bursts.
At the same time, coastal risks are rising. Research shows that rare sea-level extremes (once-in-100-year events) could start occurring almost every year by mid-century, especially along the Arabian Sea coast.
Taken together, these trends suggest that future flood risk will not only be greater in magnitude, but also harder to anticipate using historical records alone.
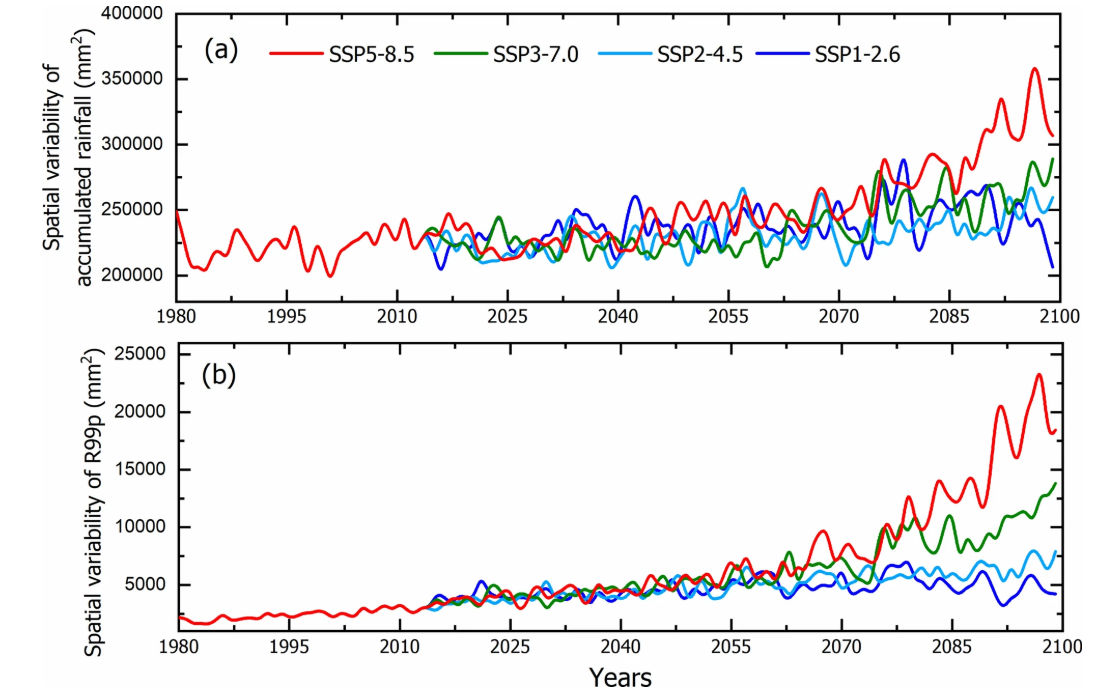 This figure shows JJAS total rainfall and extreme rainfall (R99p) across 1980–2100 under different SSP scenarios.
Source: future changes in extreme rainfall during the Indian summer monsoon.
Who Gets Hit: Sector-by-Sector Exposure
What was once treated primarily as a humanitarian concern is now a systemic economic exposure affecting infrastructure, finance, and industrial growth. The actual threat emerges from our persistent tendency to undervalue this particular risk. Most physical harm that occurs results in supply chain disruptions and business interruptions which create enduring financial pressure.
- Infrastructure & Highways
Infrastructure takes the first blow because floods do not just damage buildings; they break connectivity. In Kerala’s 2018 floods, the state said roughly 83,000 km of roads needed repair, including about 16,000 km of major road network, In addition to that The Post Disaster Needs Assessment (PDNA) conducted by the UN under the leadership of the Government of Kerala estimates the total Recovery needs to be at USD 4.4 billion, projecting damages to roads, railways, bridges, power supply, communications, and other critical infrastructure. Once those links fail, the damage spreads outward: goods cannot move, services slow down, and regional economies lose momentum.
Figure 7: Impact of Flooding on Infrastructure
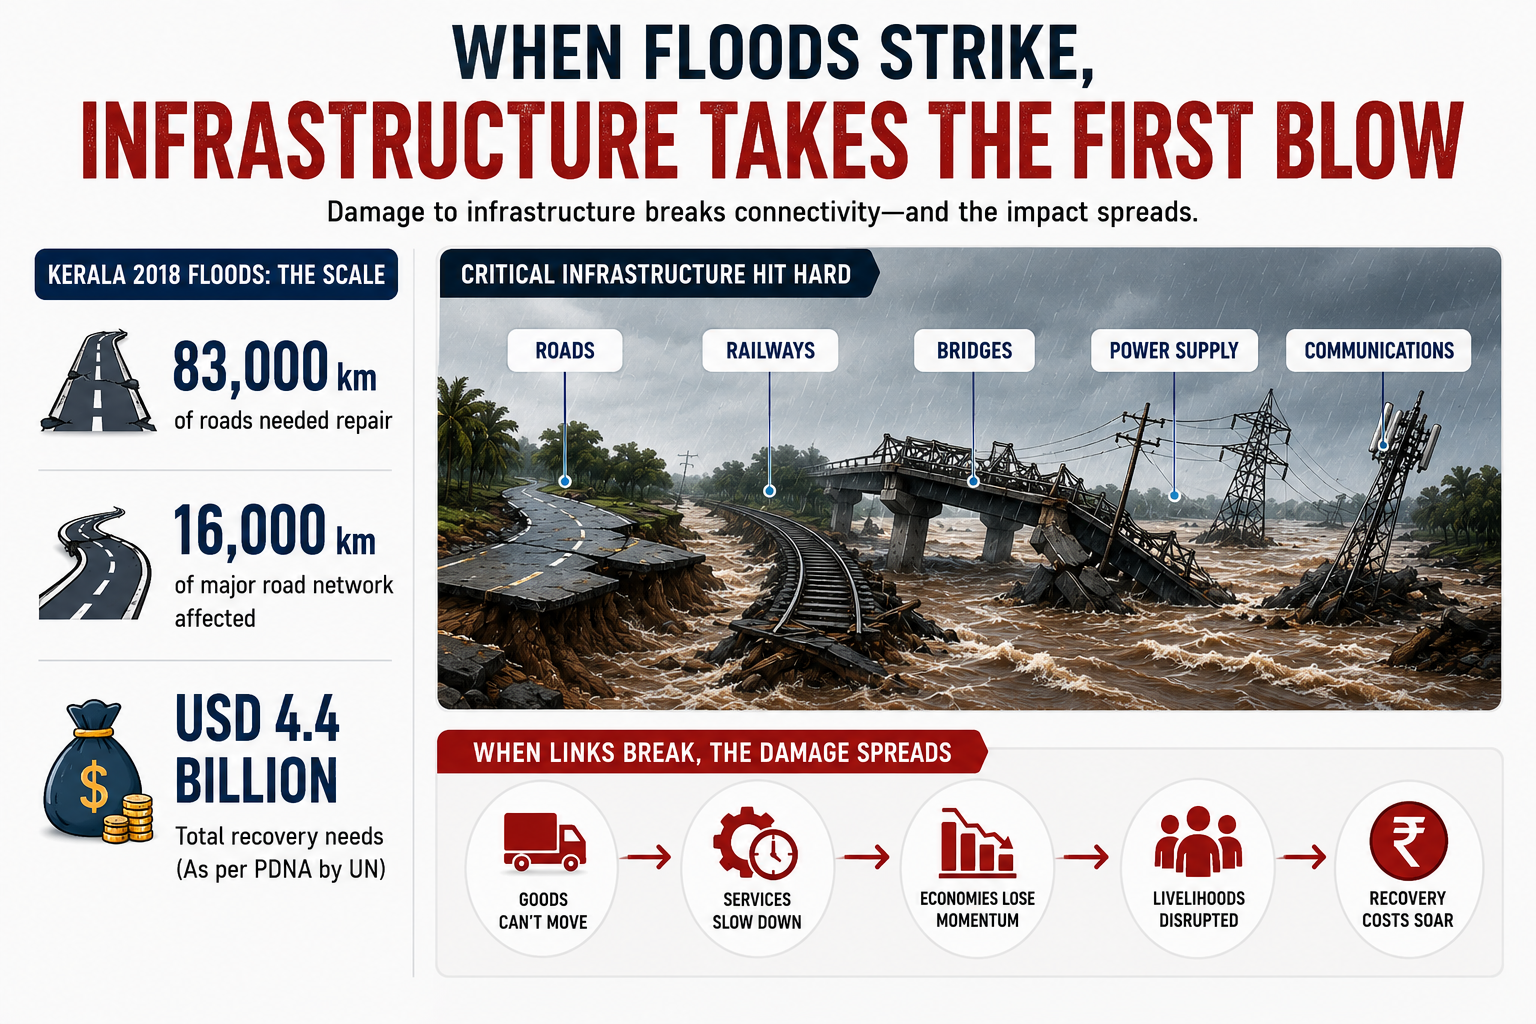 Source: PDNA
- Manufacturing & Industrial Zones
India’s industrial growth leads to increased manufacturing activities across the country. New industrial areas develop as auto hubs and pharma zones and electronics corridors establish themselves in regions that are undergoing rapid urban development and lack proper drainage systems and effective land-use planning.
Swiss Re warns that as cities like Bengaluru, Pune, Mumbai, Chennai, Hyderabad, Guwahati, Kochi, and others expand, flood hotspots are emerging in places that were not previously treated as high-risk.
The bigger cost is often not physical damage to machinery but business interruption. A global study in Water estimates annual average flood-related business interruption losses of USD 26.9 billion, with ripple effects through trade and supply chains that can be as serious as direct asset damage.
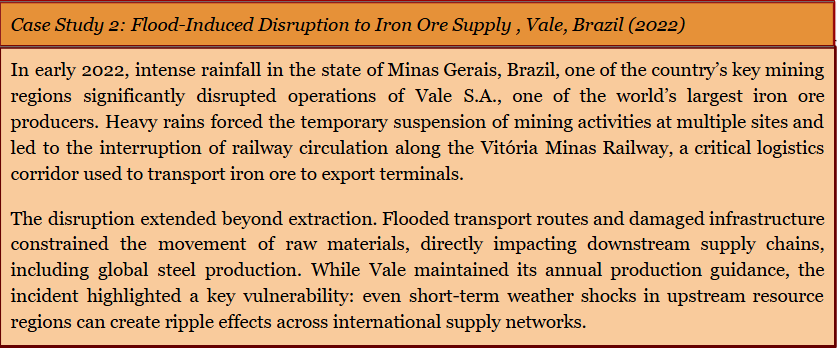 Source: Mining Weekly — “Vale halts iron ore operations due to heavy rains”
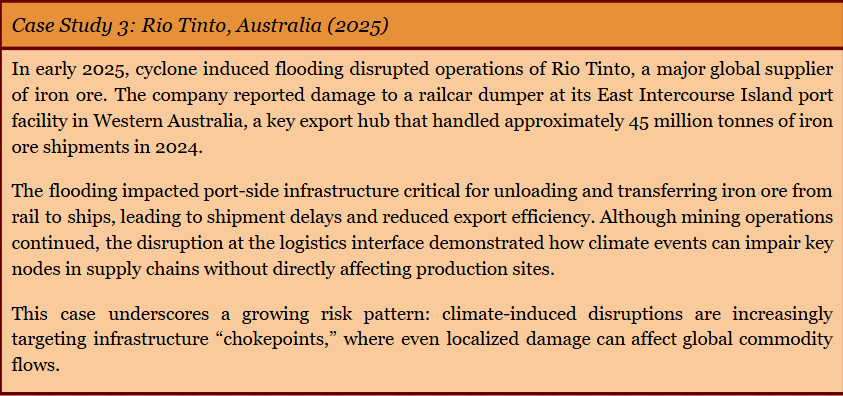 Source: Reuters “Rio Tinto sees shipment disruptions after cyclone-induced flooding”
- Tourism Sector
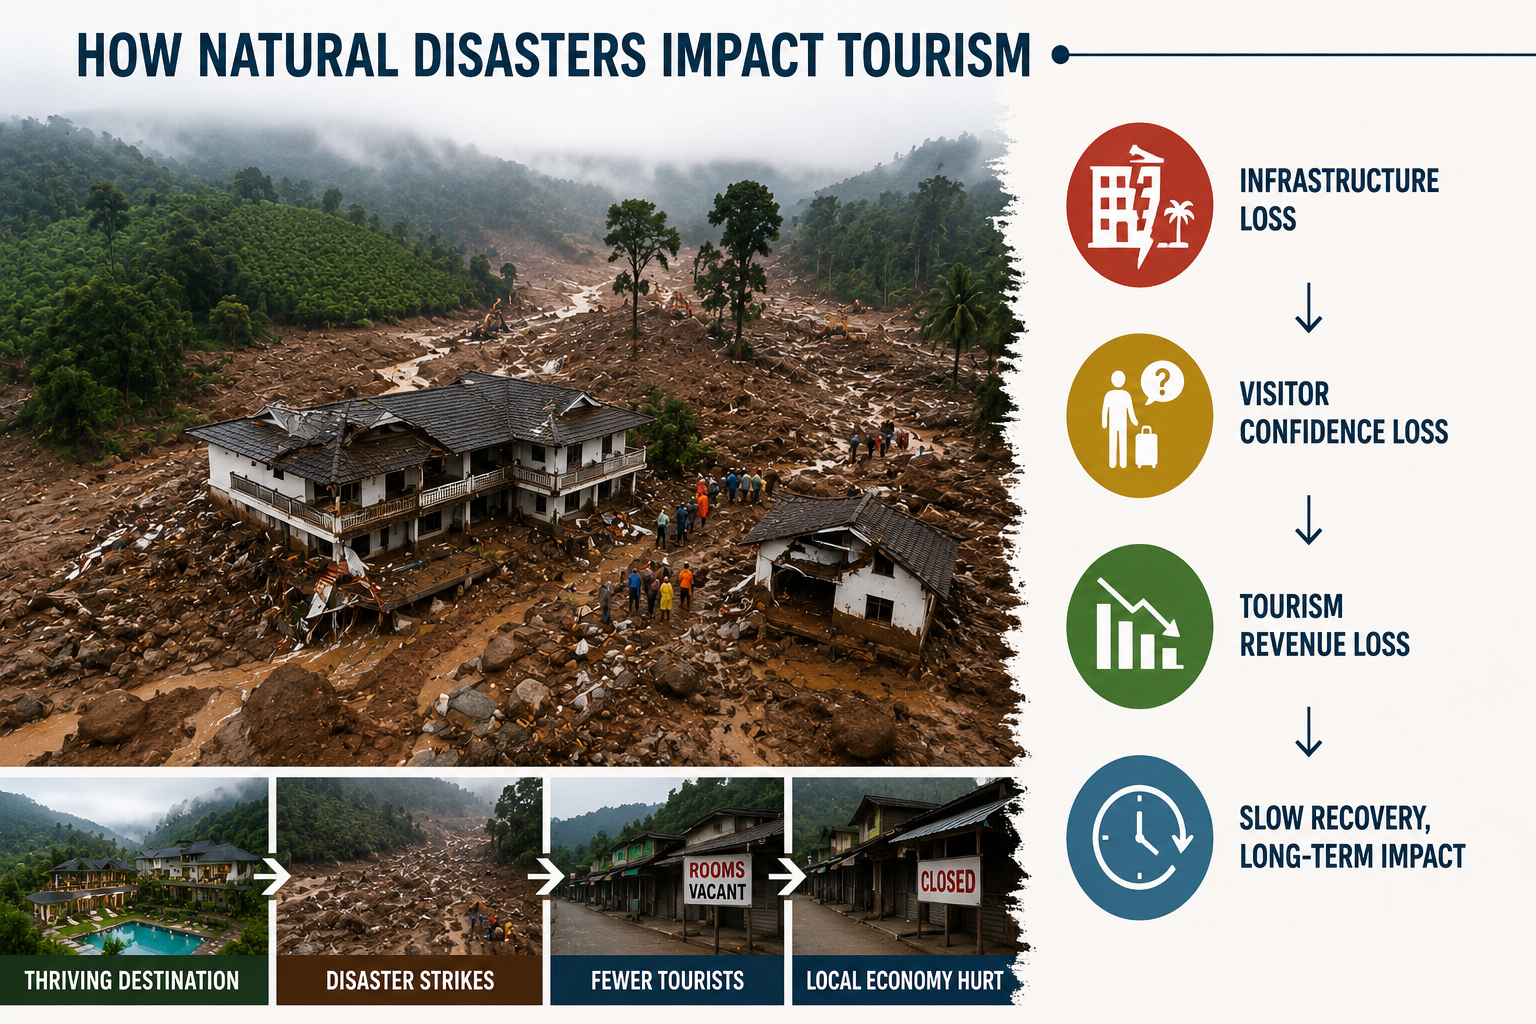
The tourism industry suffers from high vulnerability because its valuable resources exist in fragile geographic locations which include hill stations, coastal resorts and heritage destinations. The 2024 landslide disaster in Wayanad destroyed a popular resort according to Reuters which reported that the disaster resulted in 205 fatalities and created major concerns about development activities in areas with ecological sensitivity. The lesson is broader than one district: tourism losses often arrive as both physical damage and reputational shock, and recovery can take longer because visitors do not return on an engineering timetable; they return when confidence does.
Figure 8: How Natural Disasters Impact Tourism
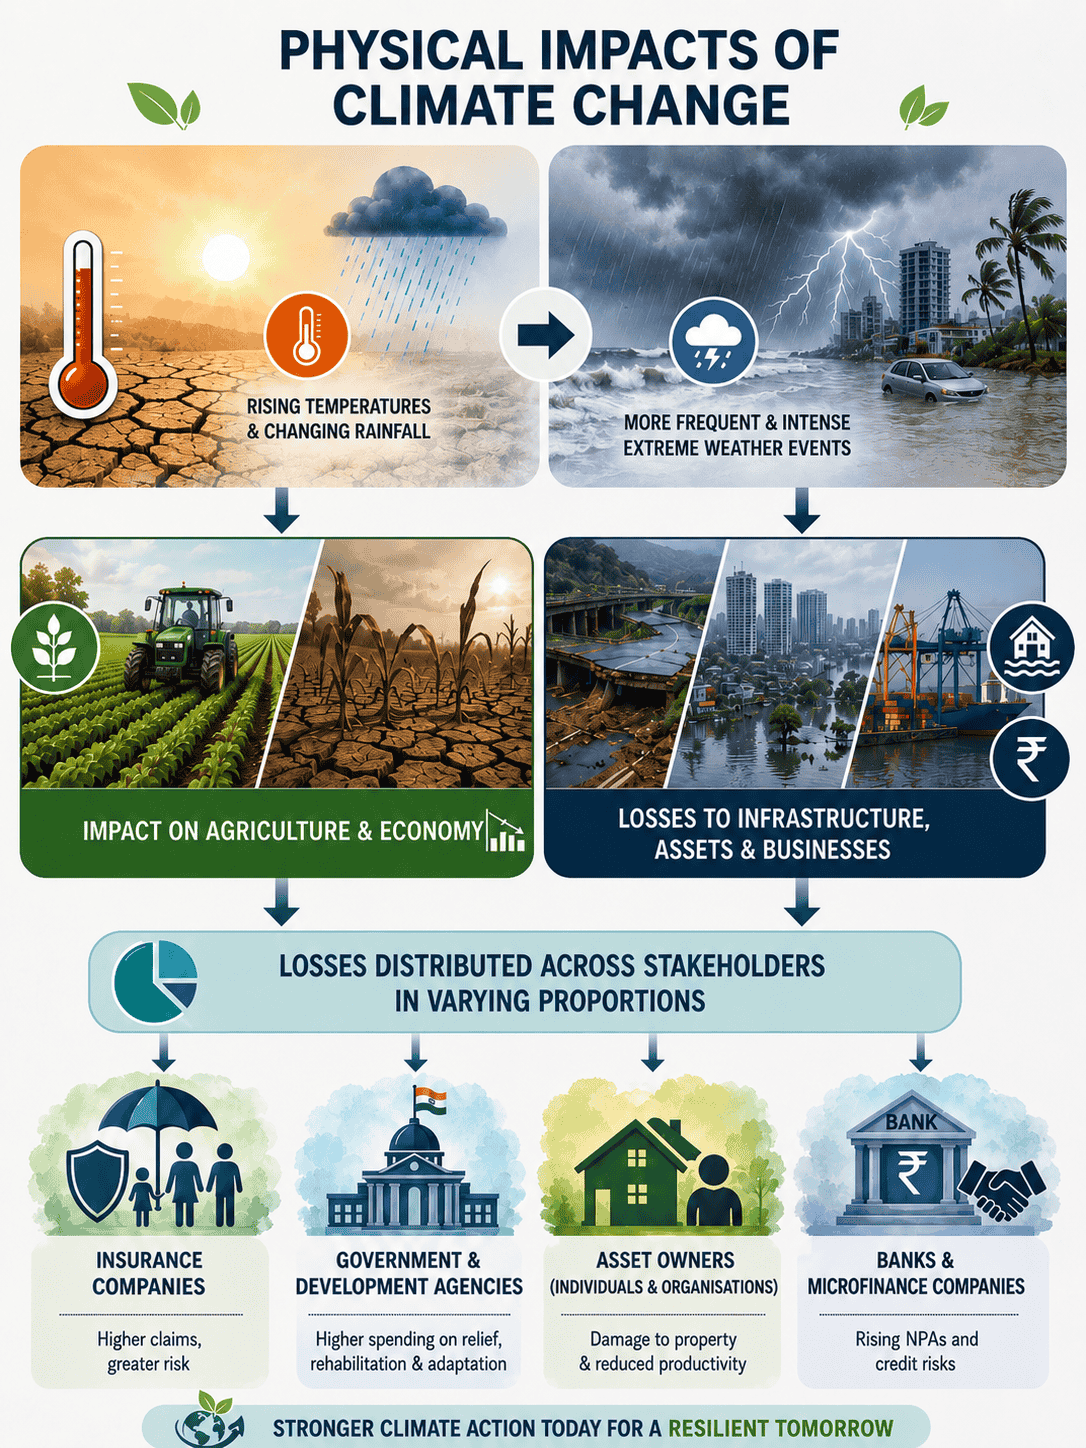
- BFSI (Banking, Financial Services & Insurance)
Flood risk also sits quietly inside financial portfolios. Floods damage physical assets and increase non-performing loans (NPLs) when borrowers default and they interrupt business activities. Swiss Re estimates that a repeat of the 2005 Mumbai flood today could cost as much as INR 20,000 crore, compared with about INR 2,250 crore in actual claims at the time, a gap driven by asset growth and rising exposure.
Mongabay’s report describes how insurers continue to use historical data for their operations because climate disasters now occur with greater frequency and higher intensity, which complicates their pricing and reinsurance processes. The risk exists in multiple areas which include insurance products, mortgage books, agricultural credit, SME lending and the overall financial system.
Figure 9: Flood risk inside Financial Portfolios
A Framework for Action: Identify → Quantify → Manage
The problem with many flood strategies today is not that they ignore risk, but that they rely on models and thresholds designed for a very different climate and urban reality. Early advances like Sampson et al. High-Resolution Global Flood Hazard Model marked an important step forward, but even this work highlights a key limitation that is the accuracy of flood predictions is still heavily dependent on the quality of terrain data.
Today’s floods are more local, more sudden, and more complex than before. This means responses also need to evolve, moving beyond reactive relief toward a more structured approach: identify risk accurately, quantify it realistically, and manage it through layered adaptation.
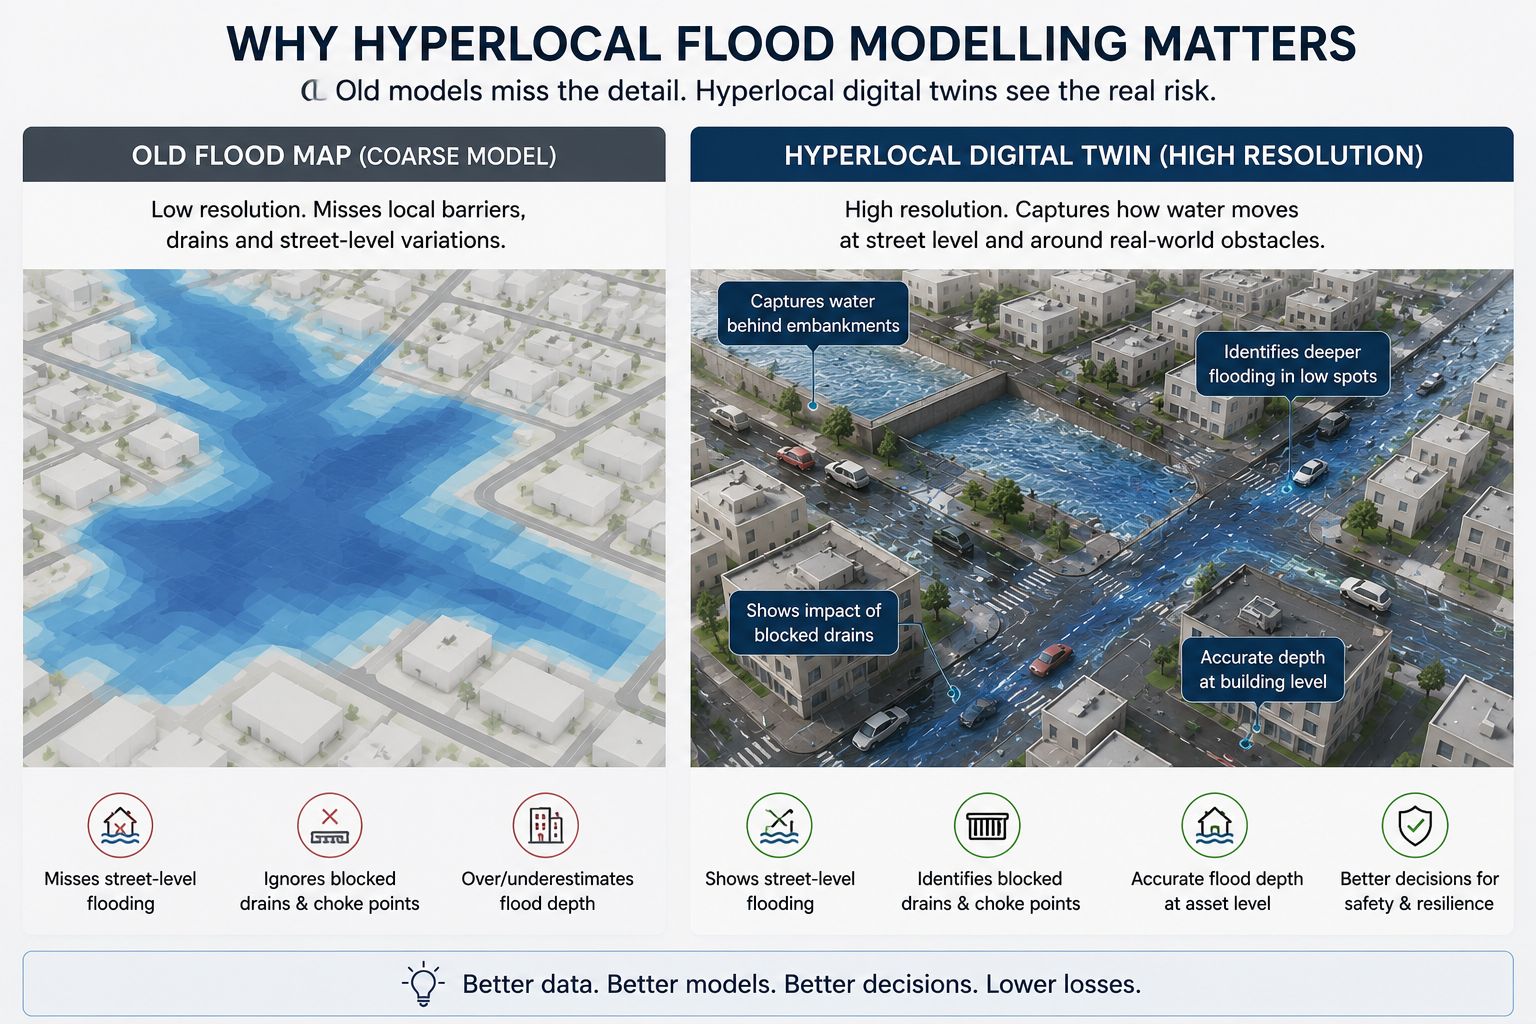
Identify: Hyperlocal Flood Modelling
The first step is understanding flood risk at the scale where it actually occurs. Hyperlocal flood modelling focuses on street level simulations, helping estimate not just where flooding may happen, but also how deep it could get and how long it might last, especially for specific buildings and infrastructure.
A DEM is a bare-earth elevation model, while a DSM includes buildings and vegetation, the difference matters in cities because water does not move across an empty surface, it moves around roads, embankments, walls, and blocked drains.
What newer research adds is even more local detail. A 2025 study combining DEM, DSM, and airborne LiDAR found that the hybrid approach captured localized flood depth increases of 1.5–2.0 m behind embankments and reduced false positives in vegetated areas by 12–18% compared with simpler models. At the city scale, the newer FlowsDT digital-twin approach goes one step further by combining LiDAR and storm-sewer data to simulate street-level flood dynamics in real time.
Figure 10: Hyperlocal Flood Modelling
Quantify: Return Periods, Coverage Gaps & Probabilistic Loss
Identifying flood risk is only the first step. The next challenge is understanding how often an event of a certain scale is likely to occur — and whether businesses, cities, and financial systems are prepared for it.
This is where the idea of a return period becomes important. A “1-in-100-year flood” does not mean such a flood happens only once every hundred years. It simply means there is a 1% chance of that event occurring in any given year. Likewise, a 1-in-200-year event carries a 0.5% annual probability. The problem is that many infrastructure systems and insurance frameworks in India were designed using historical climate assumptions, while climate change is rapidly altering those probabilities.
Kerala’s 2018 floods are a strong reminder of why this matters: the event was linked to rainfall with very high return periods, yet the scale of exposure had clearly outgrown the systems meant to handle it. The larger issue is the protection gap — the difference between total economic loss and what is actually insured. Global and India-specific research shows that flood exposure is large, especially in low- and middle-income countries, and that India carries a major share of that risk.
In a climate where “extreme” events are becoming more frequent, historical averages are no longer enough for planning.
Figure 11: 2018 Kerala floods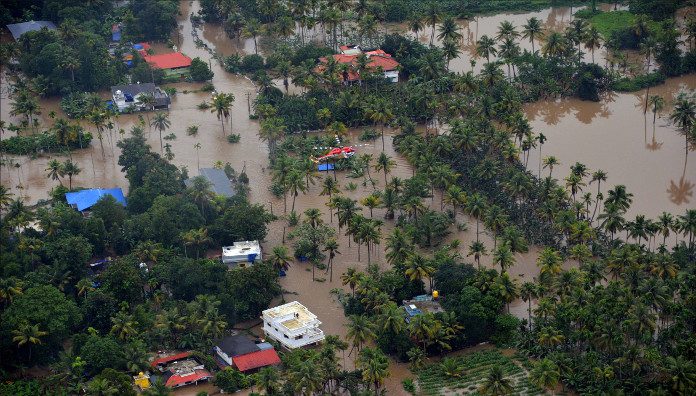 Source: 2018 Kerala flood
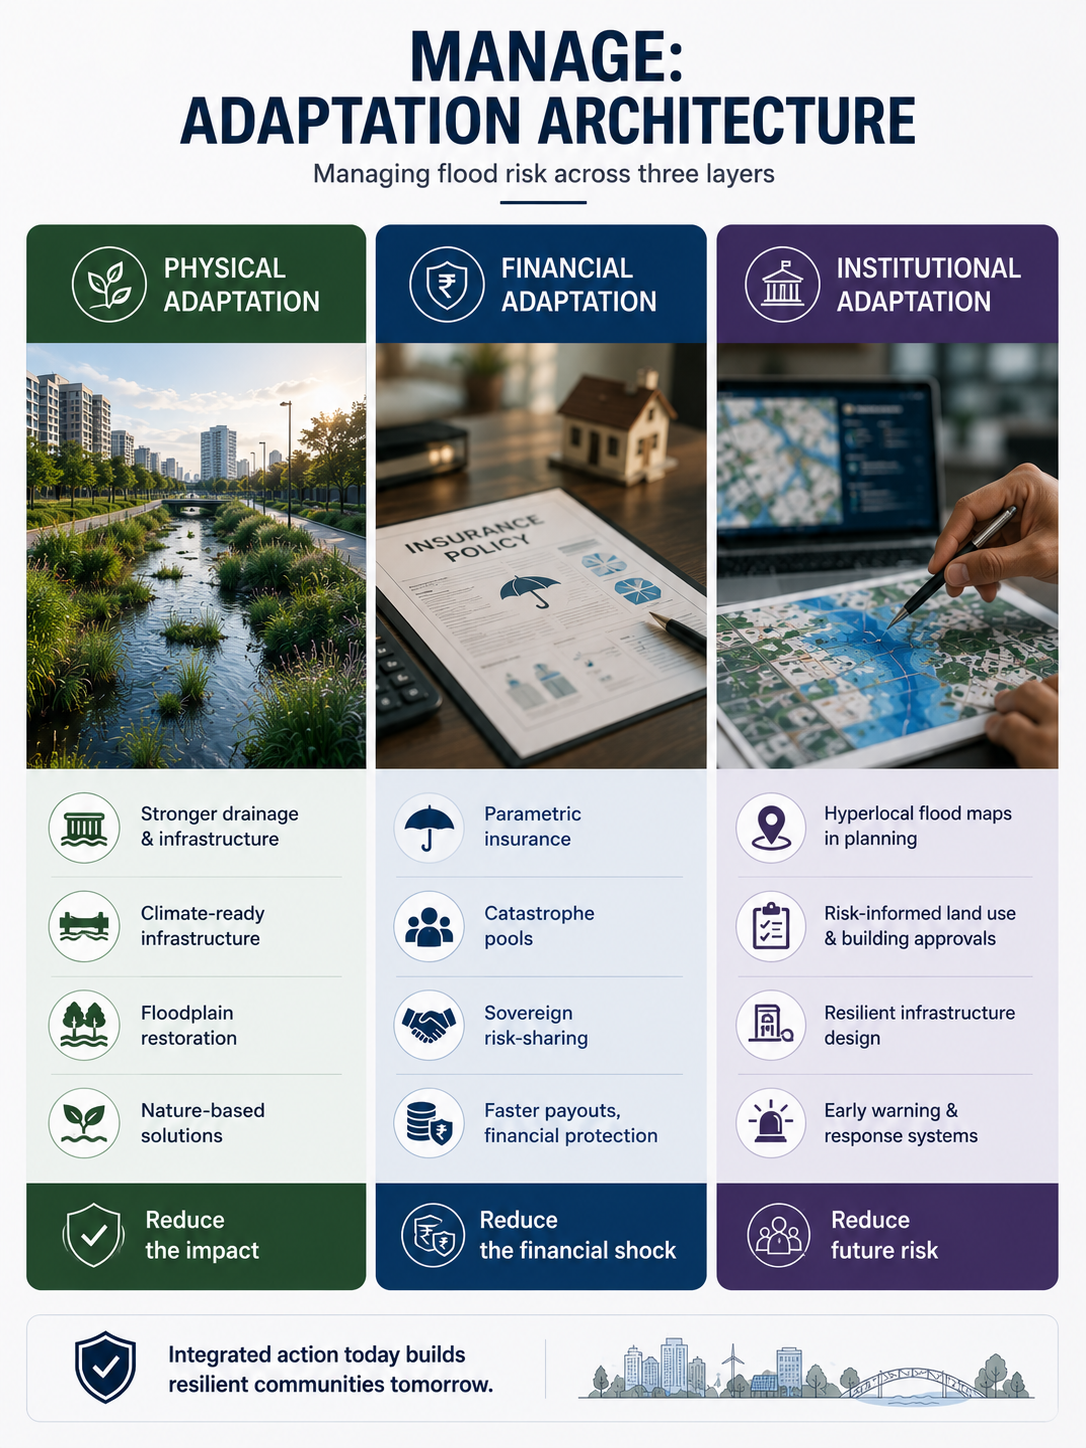
Manage: Adaptation Architecture
Once risk is identified and quantified, it has to be managed across three layers.
Physical adaptation means stronger drainage, climate ready infrastructure design, floodplain restoration, and nature based solutions like mangroves, and wetlands. Swiss Re’s research shows that protective measures can reduce flood damage quite a lot, and in many cases they pay for themselves several times over as well.
The second is financial adaptation. Even if physical protection exists, the losses still can be huge. This is where tools like parametric insurance, catastrophe pools, and sovereign risk-sharing arrangements come in. They help by pushing money faster after an event, so companies , families, and public authorities don’t stay stuck waiting for recovery funds.
The third is institutional adaptation. Flood risk information must move beyond reports and into decision-making. Hyperlocal flood maps need to shape land-use planning, building approvals, infrastructure design, and emergency response systems so that risk is considered before construction begins, not only after damage occurs.
Figure 12: Adaptation Architecture
“It is not the strongest or the most intelligent who will survive but those who can best manage change.”
— Charles Darwin